ProtSA Help & Credits
The unfolded ensemble is central in developing the theoretical framework for folding processes because it represents the starting point from which the protein evolves to the native state. It is also central to understanding and calculating protein conformational stability, which arises from the differential enthalpy and entropy of the folded an unfolded ensembles. ProtSA generates and returns coordinate files of unfolded structures, providing in this way, an accurate structural model of the unfolded ensemble of your protein.
From the structures generated, ProtSA calculates the sequence-specific solvent accessible surface area (SASA) of protein residues in the unfolded ensemble. The accessibilities calculated for any residue are strongly sequence-dependent and may be useful to understand mutational studies in proteins and to improve parameterizations of protein folding energetics.
In addition to the sequence-specific SASA of the unfolded ensemble, ProtSA can calculate the change in SASA upon folding, if you indicate or provide a PDB file for the folded structure.
The references for ProtSA (Estrada et al. (2009) and Bernadó et al. (2006)), and some related ones appear at the Bibliography section.
Methodology
To calculate the average SASA of a protein in the unfolded state, this web application generates an ensemble of unfolded protein conformations. When you provide as input a 3-D structure of the protein, ProtSA assumes it represents the folded state, and uses it for calculating the SASA of the folded state and the change in SASA of the protein upon folding. The key parts of the methodology are: modeling of the unfolded ensemble and calculation of solvent accessibility given a 3-D structure.
Modeling of the unfolded ensemble
ProtSA creates each conformer in the ensemble using the flexible-meccano algorithm described in Bernadó et al. (2005), and following the methodology of Bernadó et al. (2006). First, ProtSA generates the backbone of the conformer, and then adds the side chains.
Flexible-meccano’s Monte Carlo algorithm uses a subset of the database of amino-acid-specific Φ-and-Ψ torsion angles described in Lovell et al. (2003) (500 high-resolution X-ray structures with resolutions of < 1.8 Å and B factors < 30 Å2); the subset is obtained by exclusion of all residues in α-helices and β-sheets. The database includes symmetric values for glycine Φ-and-Ψ torsion angles, and has special cases for residues preceding a proline, because of their restricted conformational sampling (MacArthur and Thornton, 1991). For each protein unfolded-state conformation the algorithm constructs the backbone starting at the C-terminal. Residue i is connected to residue i + 1 by selecting a random pair of Φ-and-Ψ angles, for the type of residue i, from the torsional subset database. If residue i presents clashes with other residues (where residues are represented as spheres centered at the Cβ atom – the Cα atom for glycine residues– using radii derived from Levitt’s force field (Levitt, 1976)), the Φ-and-Ψ torsion-angle pair is rejected, and another one is randomly selected. If, after 500 tries, the algorithm does not find a non-clashing Φ-and-Ψ torsion-angle pair, the partially-built conformation is rejected and the algorithm starts again at the C-terminal residue.
Once ProtSA has built the backbone of a given conformer, it adds the side chains using the program Sccomp (http://ligin.weizmann.ac.il/space/programs/), which places and optimizes side-chain conformations in a fixed protein backbone (Eyal et al., 2004). Although Sccomp has been developed and tested for folded proteins, it has been demostrated to be especially accurate for partially exposed side chains, due to the inclusion of a solvent-accessible term that accounts for the solvation free energy.
The unfolded model includes only the protein part of each chain (that is, no heterogroups are considered), and hydrogens are not considered for SASA calculations. No OXT atom is considered for the C-terminal residue either.
Calculation of SASA for 3-D protein structures
This web application employs the Alphasurf part of the ProGeom software (http://koehllab.genomecenter.ucdavis.edu/people/koehl/research/proshape) for SASA calculations. Conceptually, a probe is rolled around the Van der Waal’s surface of the 3-D structure (Lee and Richards, 1971), and the path traced out by its centre is the accessible surface. Typically, the probe has the same radius as water (approximately 1.4 Å) and hence the surface described is often referred to as the solvent accessible surface. From the 3-D structure, Alphasurf calculates the exact surface area using an analytical method based on the alpha shapes theory.
ProtSA removes all hydrogen atoms before doing the SASA calculations. The set of Van der Waal’s atomic radii used are those of Naccess (http://www.bioinf.manchester.ac.uk/naccess/), which in turn were taken from Chothia (Chothia, 1976). For atoms in residues other than the standard 20 types, a radius of 1.80 Å is used.
Table 1: Van der Waal’s atomic radii (in Å) used in SASA calculations (from Chothia (Chothia, 1976)). For atoms in residues other than the standard 20 types, a radius of 1.80 Å is used.
| oxygen | 1.40 |
| trigonal nitrogen | 1.65 |
| tetrahedral nitrogen | 1.50 |
| tetrahedral carbon | 1.87 |
| trigonal carbon | 1.76 |
| sulphur | 1.85 |
Folded state structure
You may provide a 3-D structure modeling the folded state of the protein of interest.
ProtSA calculated its SASA with Alphasurf as described above, after removing water molecules and hydrogens.
ProtSA functioning
Figure 1 shows the basic steps followed when servicing a request to ProtSA. Once you submit the input form, ProtSA checks completeness and formatting of the input, and queues the request, notifying you in a new web page about the acceptance of the request. Once ProtSA finishes with the previous requests, the turn of servicing your request starts. ProtSA then checks for correctness the protein information you provided and, if it contains several protein models, it selects one for calculations. ProtSA then generates the unfolded ensemble (as explained above) and calculates the average SASA of the ensemble, per atom and per residue (folded state SASA calculations are done too, if you provided a 3-D structure of your protein). After the calculations, ProtSA sends the results to the e-mail address you provided. The following subsections will detail all these steps just described; probably, the details more interesting to you are those dealing with input data and output information.
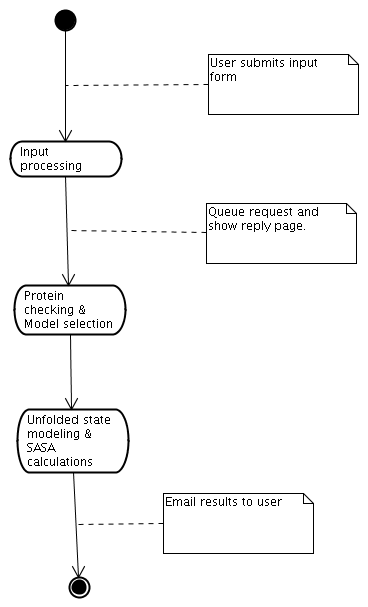
Figure 1:
Service functioning diagram
Input data and input checkings
You have three ways to enter the protein sequence to ProtSA: As a PDB file, as a PDB id referring to a PDB file in the Protein Data Bank, and as a text string with each residue codified as a single character. In the two former cases, the protein may consist of more than one chain and, if the coordinates for all the atoms are present, the solvent accessibility for the folded state will be calculated.
You can control some parameters of the ensemble generation and the algorithm for calculating the SASA, such as the number of unfolded conformations to generate per protein chain, and the solvent probe radius. You must provide an e-mail address for receiving the results of the calculations, and must also give a title to your request. A general explanation of the fields follows, and further details are provided afterwards.
Title for this job
A short title (max. 200 characters) for helping you in identifying the request when receiving the e-mail message with the results. In addition, ProtSA also provides a unique identifier for your job request.
Protein input
You must provide, at least, the primary structure of the protein. You have three ways of doing so (choose only one of them). You select the desired way by using the radio buttons. Those ways not selected will appear as disabled. Your protein must not have more than 1,000 residues and no more than 10,000 heavy atoms.
- You provide a text file following the PDB format (see http://www.wwpdb.org/docs.html). ProtSA currently admits PDB format version 2.3, but other versions will probably work too.
For folded state calculations, you must provide in the PDB file the coordinates for all the atoms in the protein. If the file contains several protein models, ProtSA will choose the first one that allows for folded state calculations or, if that is not possible, the first one implicitly specifying a protein sequence in its coordinate section. If the protein consists of several chains, ProtSA will calculate an unfolded ensemble for each one of them. Your file must not exceed the maximum size of 10 MB (10,000,000 bytes).
- You provide a PDB identifier (4 characters) uniquely identifying a PDB file in the Protein Data Bank (http://www.wwpdb.org). ProtSA will request that file to the RCSB PDB web site (http://www.pdb.org), and will process that file as if you had sent it directly to ProtSA.
- You provide the sequence of a single polypeptide chain. It must consist of standard residues only (see below), and it starts at the N-terminal going through the C-terminal. 1,000 residues max. You specify each residue using its standard one-character code (either upper- or lower-case).
| Alanine | A | Leucine | L | |
| Arginine | R | Lysine | K | |
| Asparagine | N | Methionine | M | |
| Aspartic acid | D | Phenylalanine | F | |
| Cysteine | C | Proline | P | |
| Glutamic acid | E | Serine | S | |
| Glutamine | Q | Threonine | T | |
| Glycine | G | Tryptophan | W | |
| Histidine | H | Tyrosine | Y | |
| Isoleucine | I | Valine | V |
For instance, you would enter the sequence for the LDL receptor ligand-binding module 5 (PDB id 1ajj) as: PCSAFEFHCLSGECIHSSWRCDGGPDCKDKSDEENCA
Solvent radius
You provide the radius, in angstroms, of the solvent probe used for the SASA calculations (as described in the methodology section). A typical value is 1.4 Å (approx. radius of water), but you can provide any value greater than or equal to 0.0.
Unfolded conformations to generate
You provide the number of conformations to generate in the unfolded ensemble (for each chain in the protein). As shown in Bernadó et al. (2006), 2,000 conformations is a good choice. Since the time that ProtSA needs to service your request depends mainly on the size of the protein and the number of conformations to generate, you may prefer to set a smaller number. Allowed values lie in the range [1, 2000].
E-Mail address
You must provide an e-mail address to receive the results. Please, double check that you enter it right, since if the address is mispelled, your results will get lost. We only use the e-mail address for the purpose of sending you the results, and for monitoring the fair use of this service.
Attach unfolded conformations generated
You can check this option to get a link in your email to download the unfolfed conformations generated
Request reception output
After submitting the input form, ProtSA will present you a web page saying whether your request has been accepted or not. The only reasons to deny your request are that, either that ProtSA has too many pending requests to process (in such a case, please try to submit your request later again), or that ProtSA found some error with your input data (such as non-allowed values or missing fields); anyway, you will be informed of the reason for the denial.
If your request is accepted, ProtSA will email the results to you after doing the calculations. Depending on several factors (number of pending requests, size of the protein, number of conformations to generate), you may have to wait from several hours to several days.
Results
You will receive an e-mail with the results of the calculations. This e-mail will contain a body section, and will attach a summary of the calculations as a HTML summary section, with all the data provided in an attached zipped archive file. The e-mail will have the subject ProtSA Results (job 47) (with your job id instead of 47). If ProtSA had problems when doing the calculations, you will receive instead an e-mail with the subject ProtSA error (job 47).
Message body
The body repeats all the information that you provided to ProtSA in the input form. Afterwards comes a small summary of the protein data, including:
- number of models in the input protein.
- number of models valid for both folded and unfolded SASA calulations.
- number of models valid only for unfolded SASA calculations.
- number of non valid models.
- the number of the model selected for calculations.
Then, a summary of the selected model appears, including:
- number of chains.
- number of chains containing only standard residues.
- number of chains containing non standard residues.
- number of empty chains.
For each chain in the selected model, some data is provided:
- number of residues in the chain.
- number of heterogroups different from water.
- number of water molecules present.
- names of the heterogroups found.
An example message body
An HTML page with a summary of your job and your results is attached to this e-mail message.
Attached (in a zip file) are your results for the folded and unfolded state.
Your job name: a
Your job id: 47
Your parameters:
pdb Id: 1ftg
radius: 1.4
conformations: 2
emailAddress: This email address is being protected from spambots. You need JavaScript enabled to view it.
Num models: 1
Num models valid for both folded and unfolded state calculations: 1
Num models valid only for unfolded state calculations: 0
Num non valid models: 0
Numer of the selected model: 1
MODEL INFORMATION
Information for the selected model:
Model number 1 VALID for folded and unfolded calculations
Num chains: 2
Num peptidic chains: 1
Num HET Chains: 1
Num empty Chains: 0
Chain id HET
Num residues in chain: 0
Num HET groups (non HOH): 1
Num water molecules: 94
HET group names: SO4
Chain id A PEPTIDIC, VALID for folded and unfolded calculations
Num residues in chain: 168
Num HET groups (non HOH): 0
Num water molecules: 0
HTML summary of results
You can save the HTML page attached to the e-mail, and open it with a web browser. Alternatively, you could open the HTML page in your e-mail client software, but most client software do not correctly represent HTML pages.
The summary starts with the same information as in the message body (see above).The calculated SASA values are summarized in a sequence where residues are colored by their relative value of SASA. The actual SASA figures appear in a table with the SASA per residue, and another table with the SASA per atom. At the end is included an additional table with errors and warnings, if any, related to the input you provided about your protein.
Since the unfolded calculations consider only protein residues, heterogroups are not included in the data tables (though they influence folded SASA values of protein residues and its atoms). As stated above, hydrogen atoms are not considered neither for folded nor for unfolded calculations, so they do not appear in the data tables. OXT atoms at the C-terminal residues of each chain are not included either, since they are not considered in unfolded SASA calculations.
For the data described below, unless otherwise stated, all SASA values are in squared angstroms. The polar part of a residue is the set of oxygen and nitrogen atoms; all the other atoms form the nonpolar part. The main chain of a residue consists of the N, O, Cα and C′ atoms; all the other atoms form the side chain.
SASA values in the unfolded ensemble, per residue, are summarized in a colored sequence where the color scale shows the relation, in percentage, between the unfolded SASA of the individual residues and that of the average unfolded SASA for that residue type for a test set of 19 proteins.
unfolded SASA i
average unfolded SASA type(i)
where i is the residue position in the protein sequence, and type(i) is the type of that residue.
(1)
Table 3: Set of 19 proteins used for obtaining average SASA values per residue type in the unfolded and folded states. Number of residues studied in the folded calculations appear in parentheses.
| PDB id | No. residues studied | Unfolded/Folded | Link to PDB entry |
|---|---|---|---|
| 1ln4 | 98 (98) | Both | PDB entry |
| 1bkr | 109 (108) | Both | PDB entry |
| 1bgf | 124 (124) | Both | PDB entry |
| 1jb3 | 131 (127) | Both | PDB entry |
| 2lis | 136 (131) | Both | PDB entry |
| 1ey4 | 149 (136) | Both | PDB entry |
| 1ep0 | 185 (183) | Both | PDB entry |
| 1byi | 224 (224) | Both | PDB entry |
| 1es9 | 232 (212) | Both | PDB entry |
| 1wer | 334 (324) | Both | PDB entry |
| 1e5m | 416 (411) | Both | PDB entry |
| 1t1d | 100 | Unfolded | PDB entry |
| 1qgv | 142 | Unfolded | PDB entry |
| 1l3k | 196 | Unfolded | PDB entry |
| 1ii5 | 233 | Unfolded | PDB entry |
| 1fo9 | 348 | Unfolded | PDB entry |
| 1fcq | 350 | Unfolded | PDB entry |
| 1gso | 431 | Unfolded | PDB entry |
| 2bce | 579 | Unfolded | PDB entry |
For the unfolded state, 2000 unfolded conformations were generated for each protein, and each residue was assigned the average of the SASA in all the conformations. SASA calculations employed default values, with a probe radius of 1.4 Å, and van der Waals’ radii listed in the section on calculation of SASA. Then, the five residues in each terminal side of the protein sequences were discarded, and for all residues of the same type, an average SASA value was obtained.
These values, and the number of residues that were used for the averaging, are:
Table 4: Average SASA in the unfolded and folded states, per residue type, in the set of 11 proteins
| Residue name | No. residues studied (unfolded) | No. residues studied (folded) | Avg. unfolded SASA (Å2) | Avg. folded SASA (Å2) |
|---|---|---|---|---|
| Alanine | 349 | 159 | 73.23 | 22.53 |
| Arginine | 233 | 101 | 178.88 | 109.34 |
| Asparagine | 198 | 93 | 109.19 | 55.05 |
| Aspartic acid | 255 | 104 | 102.19 | 64.37 |
| Cysteine | 51 | 27 | 88.67 | 16.68 |
| Glutamic acid | 287 | 137 | 126.04 | 76.71 |
| Glutamine | 171 | 75 | 125.85 | 79.58 |
| Glycine | 312 | 136 | 54.32 | 21.36 |
| Histidine | 115 | 68 | 129.47 | 77.43 |
| Isoleucine | 229 | 119 | 122.49 | 23.75 |
| Leucine | 407 | 208 | 131.87 | 28.36 |
| Lysine | 247 | 113 | 149.93 | 106.07 |
| Methionine | 102 | 52 | 134.31 | 42.30 |
| Phenylalanine | 174 | 65 | 146.14 | 25.16 |
| Proline | 217 | 88 | 100.26 | 61.21 |
| Serine | 198 | 88 | 75.97 | 31.33 |
| Threonine | 245 | 115 | 93.34 | 44.70 |
| Tryptophan | 70 | 25 | 173.24 | 39.53 |
| Tyrosine | 148 | 55 | 156.93 | 55.77 |
| Valine | 320 | 140 | 102.19 | 20.13 |

Figure 2: Sample output for a colored sequence with data for the unfolded state
If you provided ProtSA with a folded structure, then SASA values in the folded state, per residue, are summarized in a colored sequence where the color scale shows the relation, in percentage, between the folded SASA of the individual residues in your folded structure, and that of the average folded SASA for that residue type for an 11-protein subset of the test set of 19 proteins described above.
folded SASA i
average folded SASA type(i)
where i is the residue position in the protein sequence, and type(i) is the type of that residue.
(2)
Reference SASA values for each residue type were obtained after calculating SASA for each of the 11 folded protein structures as described in the section on SASA calculations for the folded state structure, using default values, with a probe radius of 1.4 Å, and van der Waals’ radii listed in the section on calculation of SASA. Then, the five residues in each terminal side of the protein sequences were discarded, and for all residues of the same type, an average SASA value was obtained. These values, and the number of residues that were used for the averaging, appear in the table above.

Figure 3: Sample output for a colored sequence with data for the folded state
Besides, when you provides a folded structure, another colored sequence is added to the results, where the color scale shows the ratio between the folded SASA of the individual residues in your folded structure, and that in the unfolded ensemble.
folded SASA i
unfolded SASA i
where i is the residue position in the protein sequence.
(3)

Figure 4: Sample output for a colored sequence with data for the relation between folded and unfolded state
Columns in the residue SASA table are:
- Residue identification columns:
- Residue name.
- Residue number.
- Residue insertion code.
- Chain id.
- Residue SASA columns, with the mean unfolded SASA for the residue, its folded SASA, and (folded - unfolded) SASA.
- Residue main chain SASA columns, with the main unfolded SASA for the residue main chain, its folded SASA, and (folded - unfolded) SASA.
- Residue side chain SASA columns, with the mean unfolded SASA for the residue side chain, its folded SASA, and (folded - unfolded) SASA.
- Residue polar SASA columns, with the mean unfolded SASA for the residue polar part, its folded SASA, and (folded - unfolded) SASA.
- Residue apolar SASA columns, with the mean unfolded SASA for the residue nonpolar part, its folded SASA, and (folded - unfolded) SASA.
Last row in the chain is filled with the totals for each column. A final grand total row contains the totals, per column, for all the residues.
Columns in the atom table are:
- Atom identification columns:
- Atom name.
- Residue name.
- Residue number.
- Residue insertion code.
- Chain id.
- Atom SASA columns, with the mean unfolded SASA for the residue, its folded SASA, and (folded - unfolded) SASA.
No total or grand total rows are included in the atom table, since they appear already in the residue summary table described before.
Finally, the HTML summary page contains a table with all the errors and warnings found when processing the protein. The table will be empty if no error or warning was found. At this time, only missing atoms and the detection of possible gaps inside the protein chains are shown in this table. Each table row states whether it is a warning or an error, the model and chain affected, and a brief description of the problem.
Data (as a single zipped archive file)
A zipped archive file with the name job{jobId}.zip is attached to the results e-mail. This file has the following structure:
coloredSASA.pdb (only if you provided a folded structure)
diff_residue.txt (only if you provided a folded structure)
diff_residue.csv (only if you provided a folded structure)
diff_atomic.txt (only if you provided a folded structure)
diff_atomic.csv (only if you provided a folded structure)
chainX/residue_accessibility.txt
chainX/residue_accessibility.csv
chainX/atomic_accessibility.txt
chainX/atomic_accessibility.csv
chainX/folded_residue_accessibility.txt (only if you provided a folded structure)
chainX/folded_residue_accessibility.csv (only if you provided a folded structure)
chainX/folded_atomic_accessibility.txt (only if you provided a folded structure)
chainX/folded_atomic_accessibility.csv (only if you provided a folded structure)
chainX/diff_residue_accessibility.txt (only if you provided a folded structure)
chainX/diff_residue_accessibility.csv (only if you provided a folded structure)
chainX/diff_atomic_accessibility.txt (only if you provided a folded structure)
chainX/diff_atomic_accessibility.csv (only if you provided a folded structure)
For each chain, there exists a folder with the name of the chain (chainX, where X is the chain identifier or _ if there is no chain identifier). The folder contains one file with the unfolded atomic SASA values for that chain, and another one with the unfolded residue SASA values. All files are in both text and Comma Separated Value (CSV) format (see http://tools.ietf.org/html/rfc4180 for the format specification) using the semicolon as separator, which can be easily imported into spreadsheet tools such as Microsoft Excel or OpenOffice Calc. However, totals and grand totals are not included in the CSV files, and must therefore be calculated inside the spreadsheet tools.
If you provided a valid 3-D protein structure, then the zipped archive file also includes the folded SASA for that structure (broke into its chain components). Differences in atomic and residue SASA for the whole protein will be contained in diff_residue.txt and diff_atomic.txt, and for each chain in files diff_residue_accessibility.txt and diff_atomic_accessibility.txt.
Also in case you provided a valid 3-D protein structure, the zipped archive contains the file coloredSASA.pdb in PDB format, which contains the model selected for the calculations and gives the ratio between residue folded and unfolded SASA (see above) in the B-factor column. This allows for a straightforward three-dimensional visualization of exposure changes associated to protein folding. If you use the Pymol or Chimera molecular viewers, you can run the provided pymol script or chimera script to obtain your structure colored with the same color scale as used by ProtSA.
Figure 5: Sample colored structure, with residues colored according to the relation between folded and unfolded SASA, using the same color scale as in the ratio color-coded sequence
As explained above, heterogroups, hydrogens and OXT atoms are not included in the data files. Heterogroups and OXT atoms, however, are included in the files showing the folded SASA per atom and per residue, since they are used for folded SASA calculations.
Residue SASA files
As shown below (see the example for a tetrapeptide of alanines), a residue_accessibility.txt file contains a legend at its beginning, followed by a table with one line per atom, and including:
- the residue name.
- the residue number.
- the residue insertion code (this is used when the pdb file uses a reference sequence for numbering, and has inserted residues relative to that sequence).
- the chain name (empty if there is no chain name).
- the unfolded SASA (averaged over the ensemble) for each residue, including the surface area for the residue components (main chain, side chain, polar atoms, non polar atoms).
- a grand total line, with the total SASA for the whole chain (and for the components: main chain, side chain, polar atoms and non polar atoms).
Table 5: chainX/residue_accessibility.txt file
- Residue name
- Residue number
- Residue insertion code (this is used when the pdb file uses a reference sequence for numbering, and has inserted residues)
- Chain name
- Mean unfolded residue accessibility in squared angstroms
- Mean unfolded residue MAIN CHAIN accessibility in squared angstroms
- Mean unfolded residue SIDE CHAIN accessibility in squared angstroms
- Mean unfolded residue POLAR (oxygens and nitrogens) accessibility in squared angstroms
- Mean unfolded residue NON POLAR accessibility in squared angstroms
ALA 2 95.851 27.820 68.031 18.311 77.540
ALA 3 109.525 48.818 60.706 31.428 78.097
ALA 4 151.631 2.127 149.504 2.127 149.504
TOTAL: 501.938 154.947 346.991 111.247 390.691
If you provided a valid 3-D protein structure, a similar residue SASA file is provided, per chain, but containing folded accessibilities, instead of mean unfolded ones. Each chain’s folded SASA depends on the other chains of the folded structure (if they are close enough in space), as opposed to the unfolded SASA calculations, where the chains are assumed to be completely isolated.
Atomic SASA files
Similarly to the residue SASA file, the atomic_accessibility.txt file has a beginning legend section, and a table with the following data per line:
- atom name
- residue name
- residue number
- the residue insertion code (this is used when the pdb file uses a reference sequence for numbering, and has inserted residues relative to that sequence).
- the chain name (empty if there is no chain name).
- the unfolded solvent accessibility surface area (average over the ensemble) for each atom.
- a grand total line, with the total accessibility surface area for the whole chain.
Table 6: chainX/atomic_accessibility.txt file
- Atom name
- Residue name
- Residue number
- Residue insertion code (this is used when the pdb file uses a reference sequence for numbering, and has inserted residues)
- Chain name
- Mean unfolded atom accessibility in squared angstroms
N ALA 1 38.347
CA ALA 1 15.841
C ALA 1 0.958
O ALA 1 21.035
CB ALA 1 68.750
N ALA 2 1.808
CA ALA 2 8.995
C ALA 2 0.515
O ALA 2 16.503
CB ALA 2 68.031
N ALA 3 8.217
CA ALA 3 16.174
C ALA 3 1.216
O ALA 3 23.211
CB ALA 3 60.706
N ALA 4 2.127
CA ALA 4 0.000
C ALA 4 0.000
O ALA 4 0.000
CB ALA 4 0.000
TOTAL: 501.938
If you provided a valid 3-D protein structure, a similar atomic SASA file will be provided, per chain, but containing folded accessibilities, instead of unfolded ones. Each chain folded SASA depends on the other chains of the folded structure (if they are close enough in space), as opposed to the unfolded SASA calculations, where the chains are assumed to be completely isolated.
Files showing SASA changes upon folding
As a convinience, two additional files show the differences in accessibility between the folded and the unfolded state, obtained from the data present in all the other files. The format of the residue SASA file is similar to that of chainX/residue_accessibility.txt, but the SASA values refer to the difference in SASA between the folded and the unfolded state.
The file finishes with the grand totals for each chain, and for the whole protein.
Table 7: diff_residue.txt file
- Residue name
- Residue number
- Residue insertion code (this is used when the pdb file uses a reference sequence for numbering, and has inserted residues)
- Chain name
- (Folded - Mean unfolded) residue accessibility in squared angstroms
- (Folded - Mean unfolded) residue MAIN CHAIN accessibility in squared angstroms
- (Folded - Mean unfolded) residue SIDE CHAIN accessibility in squared angstroms
- (Folded - Mean unfolded) residue POLAR (oxygens and nitrogens) accessibility in squared angstroms
- (Folded - Mean unfolded) residue NON POLAR accessibility in squared angstroms
1 2 3 4 5 6 7 8 9
MET 1 B -18.400 4.812 -23.212 5.317 -23.716
GLU 2 B -73.922 -17.116 -56.806 -42.677 -31.245
GLN 3 B -18.569 -15.768 -2.801 -9.595 -8.974
ARG 4 B -91.620 1.758 -93.379 -55.027 -36.593
ILE 5 B -87.325 -18.304 -69.020 -17.894 -69.431
THR 6 B -42.120 -17.992 -24.129 -30.345 -11.776
...
PHE 58 O -130.595 -11.665 -118.930 -9.288 -121.307
PRO 59 O -45.918 -18.772 -27.145 -8.651 -37.267
SER 60 O -8.951 -3.656 -5.294 -12.335 3.384
TER
CHAIN: B -3376.806 -781.292 -2595.514 -1114.691 -2262.115
CHAIN: O -3418.963 -824.554 -2594.409 -1116.777 -2302.187
MODEL TOT: -6795.770 -1605.847 -5189.923 -2231.468 -4564.302
The diff_atomic.txt file follows a format similar to that of chainX/atomic_accessibility.txt, but the SASA values refer to the difference in SASA between the folded and the unfolded state.
The file ends with grand totals for each chain, and one for the whole protein.
Table 8: diff_atomic.txt file
- Atom name
- Residue name
- Residue number
- Residue insertion code (this is used when the pdb file uses a reference sequence for numbering, and has inserted residues)
- Chain name
- (Folded - Mean unfolded) atom accessibility in squared angstroms
1 2 3 4 5 6
N LYS 2 A -38.534
CA LYS 2 A -6.108
C LYS 2 A -2.091
O LYS 2 A -9.537
CB LYS 2 A -8.359
CG LYS 2 A 3.029
CD LYS 2 A -12.835
CE LYS 2 A 2.252
...
CA GLY 168 A -0.773
C GLY 168 A 0.021
O GLY 168 A 5.377
N LEU 169 A -4.465
CA LEU 169 A 0.583
C LEU 169 A -18.745
O LEU 169 A -17.781
CB LEU 169 A -20.459
CG LEU 169 A 4.780
CD1 LEU 169 A -50.712
CD2 LEU 169 A -37.045
TER
CHAIN TOTAL: A -11678.793
MODEL TOTAL: -11678.793
The same information as above is divided into individual files, each containing the difference data for one chain. The name of these files follow the pattern chainX/diff_atomic_accessibility.txt and chainX/diff_residue_accessibility.txt, where X is the chain identifier or _ if there is no chain identifier.
Protein checking and model selection
To understand how ProtSA checks your input protein structure, and how it later selects the model to use in the calculations, it may be helpful to first understand several concepts related to PDB files:
- Each PDB file contains one or more models of the molecules it represents. Several models are typical of molecules with 3-D structures determined by NMR. ProtSA will select a single model for doing the SASA calculations, and will discard all others. Below appear the criteria followed in model selection.
- Within each model, there are one or more chains. Each chain usually represents a sequence of connected protein residues. Besides of that, several molecules (such as ligands, cofactors, salts, or water molecules) are also assigned to a chain. ProtSA will only consider the sequence of connected protein residues when generating unfolded conformations of the chain, and when later calculating the mean unfolded SASA. However, for folded state calculations (if done), all molecules (except water), are considered. Some chains may not contain any connected sequence of protein residues, but only other molecules; in such a case, that chain is ignored in unfolded calculations, but considered for folded state calculations.
- In a PDB file, the residues in a chain are numbered. However, the numbering is not necessarily consecutive. For instance, when the studied chain has insertions or deletions compared to a reference sequence, the numbering may show gaps (deletions), or repeated numbers (insertions). In the latter case, insertion codes are used to distinguish between residues with the same number. ProtSA will refer to each residue by its number and insertion code.
- Sometimes, a PDB model shows several alternative coordinates for a set of atoms. This may happen with flexible chains showing two or more main conformational states detected by a crystallographic experiment. Or it may mean an ambiguity in atom assignment (such as the crystallographically similar oxygen and nitrogen of an asparagine or a glutamine). It could even be caused by a microheterogeneous protein (where all individual protein molecules have the same sequence, except for a few residues). In all such cases, PDB files use an alternate location identifier to distinguish between the possible alternatives. In all cases, these alternatives have a residue scope, and ProtSA will choose, for each residue with alternatives, the one associated to the first alphabetical alternate location identifier.
When checking your protein input, ProtSA studies model after model (this does not apply to the input option where you only entered a residue sequence). As stated above, for each residue in the model, only the first alphabetical alternative is considered (in case it has different alternate locations). If there exist models valid for both folded and unfolded calculations, the first such model found is the one selected by ProtSA. If not, the first model valid for unfolded calculations is selected. If none is found, ProtSA cannot perform the calculations, and sends you an error e-mail.
For a model to be valid for both folded and unfolded calculations, the following requisites must be true:
- There exists at least one chain valid for both folded and unfolded calculations.
- All other chains are non protein chains, containing only other kinds of molecules (ligands, cofactors, salts, water molecules).
For a model to be valid for only unfolded calculations, the following requisites must be true:It is not valid for both folded and unfolded calculations.
- There exists at least one chain valid for unfolded calculations.
- All other chains are non protein chains, containing only other kinds of molecules (ligands, cofactors, salts, water molecules).
As for chains, they are valid for both folded and unfolded calculations ifIt has a nonempty sequence of standard residues (the 20 standard types of aminoacids).
- There are no missing atoms in the sequence of standard residues (except for, perhaps, a terminal oxygen).
- There are no gaps in the sequence.
If the chain has only the first and third properties, then it is a chain valid only for unfolded calculations.
The types of gaps detected by ProtSA are:Peptide bond distance between C and N atoms has an atypical value (outside the range 0.32-2.32 angstroms).
- Either the C or N atoms are missing, so that the peptide bond distance cannot be calculated.
- The C and N atoms appear, but have no coordinates, so that the peptide bond distance cannot be calculated.
- Numbering of the residues in the sequence is not consecutive (except for residues with insertion codes). This kind of gap is warned, but is not really considered a gap for validation purposes.
Problems that deter ProtSA
Table 9: List of problems that deter ProtSA to do the unfolded SASA calculations
- PDB id is not valid, or the PDB website could not be accessed.
- There exists no valid chain in the submitted protein.
Errors
After submitting the input form, ProtSA will present you a web page saying whether your request has been accepted or not. As said before, the only reasons to deny your request are that, either that ProtSA has too many pending requests to process (in such a case, please try to submit your request later again), or that ProtSA found some error with your input data. Below are listed all the possible error messages:
Job title too long.
Job titles can be 200 characters maximum.
No job title specified.
You did not provide a value for the job title field.
Radius cannot be a negative value.
Solvent probe radius must be greater than or equal to 0.0 Å.
Wrong radius format specified.
The value you used for radius could not be understood as a number.
No radius specified.
You did not provide a value for the solvent probe radius field.
Number of conformations not valid.
The number of unfolded conformations to generate for each protein chain must be in the range [1,2000].
Wrong number of conformations format specified.
The value you used for the number of conformations could not be understood as a number.
No conformations specified.
You did not provide a value for the number of conformations field.
E-Mail address too long.
E-Mail addresses can be 320 characters maximum.
Problems with e-mail address. Please, check syntax.
The e-mail address you provided does not seem an e-mail address.
No destination e-mail specified.
You did not provide a value for the e-mail address field.
Sorry. File size too big.
The PDB file you uploaded is too big. Maximum size allowed is 10,000,000 bytes (10 MB).
No file was uploaded.
You selected a file upload, but did not provide the file.
Sorry. PDB ID size too big.
PDB ids are 4 characters maximum.
Wrong PDB id provided.
The PDB id you provided does not match the format used by the Protein Data Bank.
Sequence too long.
The protein sequence you provided must not exceed 1,000 residues.
Wrong sequence provided.
The protein sequence you provided does not follow the format allowed.
Wrong protein information entered.
You must provide your protein information as a PDB file, a PDB id or a sequence.
No protein information entered.
You must provide information about the protein you want to process. You can send it as a PDB file, a PDB id or a residue sequence.
Technical problem.
The network connection to ProtSA failed, ProtSA had an unexpected failure, or ProtSA service is down.
Failure. Request not served.
Request queue is complete.
The limit of simultaneous requests that ProtSA can serve has been reached. Until some of these requests are completely serviced, no other requests will be accepted.
Input error.
More exhaustive tests on the correctness of the input you provided have been done, and an error was found.
Modeling of the unfolded ensemble
CSV (Comma Separated Value) format
Spreadsheet data exchange format where each line represents a spreadsheet row, and columns are separated by commas (see http://tools.ietf.org/html/rfc4180 for the format specification). ProtSA uses a variant of CSV where columns are separated by semicolons.
heterogroup
For ProtSA, it is a chemical group not part of the main component (the biological polymer) of a PDB chain. It can be a ligand, coenzyme, salt component, or even a water molecule.
job
A request done to ProtSA to calculate the unfolded SASA (and folded SASA, if possible) of a protein.
job id
Unique numeric identifier assigned to each job processed by ProtSA.
PDB (Protein Data Bank)
As described in http://www.wwpdb.org/: The Worldwide Protein Data Bank (wwPDB) consists of organizations that act as deposition, data processing and distribution centers for PDB data. The founding members are RCSB PDB (USA), PDBe (Europe) and PDBj (Japan). The BMRB (USA) group joined the wwPDB in 2006. The mission of the wwPDB is to maintain a single Protein Data Bank Archive of macromolecular structural data that is freely and publicly available to the global community.
residue main chain
Atoms N, O, C′, and Cα of a residue.
residue side chain
All the atoms of a residue that do not form the main chain.
residue polar part
Oxygen and nitrogen atoms of a residue.
residue nonpolar part
All atoms of a residue that do not belong to the polar part.
solvent accessible surface of a molecule
The surface generated by the center of a solvent sphere rolling on the van der Waals surface of the molecule.(Edelsbrunner and Koehl, 2005)
SASA (Solvent Accessible Surface Area)
Area (usually in squared angstroms) of the solvent accessible surface of a molecule or part of the molecule (such as a residue or atom).
Standard residues
The 20 typical residue types found in proteins (see table 2).
van der Waals surface of a molecule
The surface of the union of balls representing all atoms, with radii set to the van der Waals radii.(Edelsbrunner and Koehl, 2005).
Related works
BPPred(Geierhaas et al., 2007) uses a function dependent on the number of residues to calculate the overall changes of SASA upon folding; such function was derived as a regression model based on SASA values calculated using Molecular Dynamics to unfold the native conformation of a reference set of proteins. http://www-clarke.ch.cam.ac.uk/BPPred.php
George Rose’s lab server implements the method in Creamer et al. (1997). In that method, two extreme models are used: one using an extended poly-Ala peptide with a varying middle residue, and the other using peptide-fragment collections extracted from native structures. A minimum and maximum estimate for the SASA in the unfolded state of the protein is calculated using a table of fixed estimates for the 20 residue types (obtained from the two extreme models used). http://roselab.jhu.edu/utils/unfolded.html
Contact
These are the author’s affiliations and e-mail addresses (replace dashes and adjacent spaces by the at symbol):
- Jorge Estrada: jorge.estrada — unizar.es
Dep. Bioquímica y Biología Molecular y Celular. Facultad de Ciencias. Universidad de Zaragoza (Spain).
Biocomputation and Physics of Complex Systems Institute. Universidad de Zaragoza (Spain). - Pau Bernadó: pau.bernado — cbs.cnrs.fr
Centre de Biochimie Structurale. Montpellier (France). - Martin Blackledge: martin.blackledge — ibs.fr
Institut de Biologie Structurale Jean-Pierre Ebel. Grenoble (France). - Javier Sancho: jsancho — unizar.es
Dep. Bioquímica y Biología Molecular y Celular. Facultad de Ciencias. Universidad de Zaragoza (Spain).
Biocomputation and Physics of Complex Systems Institute. Universidad de Zaragoza (Spain).
Please, send any technical question regarding this service to Javier Sancho, This email address is being protected from spambots. You need JavaScript enabled to view it.
Bibliography
Baldwin, R.L. (2007). Energetics of protein folding. Journal of Molecular Biology, 371, 283–301. URL http://dx.doi.org/10.1016/j.jmb.2007.05.078.
Bernadó, P., Blackledge, M., and Sancho, J. (2006). Sequence-specific solvent accessibilities of protein residues in unfolded protein ensembles. Biophysical Journal, 91, 4536–4543. URL http://dx.doi.org/10.1529/biophysj.106.087528.
Bernadó, P., Blanchard, L., Timmins, P., Marion, D., Ruigrok, R.W.H., and Blackledge, M. (2005). A structural model for unfolded proteins from residual dipolar couplings and small-angle x-ray scattering. Proceedings of the National Academy of Sciences of the United States of America, 102, 17002–17007. URL http://dx.doi.org/10.1073/pnas.0506202102.
Chen, Y., Ding, F., Nie, H., Serohijos, A.W., Sharma, S., Wilcox, K.C., Yin, S., and Dokholyan, N.V. (2008). Protein folding: then and now. Archives of Biochemistry and Biophysics, 469, 4–19. URL http://dx.doi.org/10.1016/j.abb.2007.05.014.
Chothia, C. (1976). The nature of the accessible and buried surfaces in proteins. Journal of Molecular Biology, 105, 1–12. URL http://dx.doi.org/10.1016/0022-2836(76)90191-1.
Creamer, T.P., Srinivasan, R., and Rose, G.D. (1997). Modeling unfolded states of proteins and peptides. II. Backbone solvent accessibility. Biochemistry, 36, 2832–2835. URL http://dx.doi.org/10.1021/bi962819o.
Edelsbrunner, H. and Koehl, P. (2005). Combinatorial and Computational Geometry, volume 52 of Mathematical Sciences Research Institute Publications, chapter The geometry of biomolecular solvation, pp. 243–276. Cambridge University Press. URL http://dx.doi.org/10.2277/0521848628.
Estrada, J., Bernadó, P., Blackledge, M., and Sancho, J. (2009). ProtSA: a web application for calculating sequence specific protein solvent accessibilities in the unfolded ensemble. BMC Bioinformatics, 10, 104. URL http://dx.doi.org/10.1186/1471-2105-10-104.
Eyal, E., Najmanovich, R., McConkey, B.J., Edelman, M., and Sobolev, V. (2004). Importance of solvent accessibility and contact surfaces in modeling side-chain conformations in proteins. Journal of Computational Chemistry, 25, 712–724. URL http://dx.doi.org/10.1002/jcc.10420.
Geierhaas, C.D., Nickson, A.A., Lindorff-Larsen, K., Clarke, J., and Vendruscolo, M. (2007). BPPred: a Web-based computational tool for predicting biophysical parameters of proteins. Protein Science, 16, 125–134. URL http://dx.doi.org/10.1110/ps.062383807.
Lee, B. and Richards, F.M. (1971). The interpretation of protein structures: estimation of static accessibility. Journal of Molecular Biology, 55, 379–400. URL http://dx.doi.org/10.1016/0022-2836(71)90324-X.
Levitt, M. (1976). A simplified representation of protein conformations for rapid simulation of protein folding. Journal of Molecular Biology, 104, 59–107. URL http://dx.doi.org/10.1016/0022-2836(76)90004-8.
Lovell, S.C., Davis, I.W., Arendall, W.B., de Bakker, P.I.W., Word, J.M., Prisant, M.G., Richardson, J.S., and Richardson, D.C. (2003). Structure Validation by Cα Geometry: ϕ,ψ and Cβ Deviation. Proteins: Structure, Function, and Genetics, 50, 437–450. URL http://dx.doi.org/10.1002/prot.10286.
MacArthur, M.W. and Thornton, J.M. (1991). Influence of proline residues on protein conformation. Journal of Molecular Biology, 218, 397–412. URL http://dx.doi.org/10.1016/0022-2836(91)90721-H.
Myers, J.K., Pace, C.N., and Scholtz, J.M. (1995). Denaturant m values and heat capacity changes: relation to changes in accessible surface areas of protein unfolding. Protein Science, 4, 2138–2148.
Robertson, A. and Murphy, K. (1997). Protein Structure and the Energetics of Protein Stability. Chemical Reviews, 97, 1251–1268. URL http://dx.doi.org/10.1021/cr960383c.
Shortle, D. (1996). The denatured state (the other half of the folding equation) and its role in protein stability. FASEB Journal, 10, 27–34.
Wesson, L. and Eisenberg, D. (1992). Atomic solvation parameters applied to molecular dynamics of proteins in solution. Protein Science, 1, 227–235.
Cites
List of articles where ProtSa is cited:
2019
- Structural, thermodynamic and catalytic characterization of an ancestral triosephosphate isomerase reveal early evolutionary coupling between monomer association and function.
- Unexpected trends in the hydrophobicity of fluorinated amino acids reflect competing changes in polarity and conformation.
2018
2017
2016
- Heterodimeric interaction of the ADP-glucose pyrophosphorylase (AGPase) enzyme in Hordeum vulgare.
- TMAO-Protein Preferential Interaction Profile Determines TMAO's Conditional In Vivo Compatibility
- Osmolyte Effects on Monoclonal Antibody Stability and Concentration-Dependent Protein Interactions with Water and Common Osmolytes.
- Conformational effects in protein electrospray‐ionization mass spectrometry.
2015
- Predicting stabilizing mutations in proteins using Poisson-Boltzmann based models: study of unfolded state ensemble models and development of a successful binary classifier based on residue interaction energies.
- Semirational Directed Evolution of Loop Regions in Aspergillus japonicus beta-Fructofuranosidase for Improved Fructooligosaccharide Production.
- Inactivation of PYR/PYL/RCAR ABA receptors by tyrosine nitration may enable rapid inhibition of ABA signaling by nitric oxide in plants.
- Thermostability and reactivity in organic solvent of O-phospho-L-serine sulfhydrylase from hyperthermophilic archaeon Aeropyrum pernix K1.
- Stabilization of an alpha/beta-Hydrolase by Introducing Pro line Residues: Salicylic Acid Binding Protein 2 from Tobacco.
- Macromolecular Stabilization by Excluded Cosolutes: Mean Field Theory of Crowded Solutions.
- Its Preferential Interactions with Biopolymers Account for Diverse Observed Effects of Trehalose.
- Rational stabilization of complex proteins: a divide and combine approach.
- Is the depletion force entropic? Molecular crowding beyond steric interactions.
- Tri-peptide reference structures for the calculation of relative solvent accessible surface area in protein amino acid residues.
2014
- Role of cavities and hydration in the pressure unfolding of T-4 lysozyme.
- A Review of Methods Available to Estimate Solvent-Accessible Surface Areas of Soluble Proteins in the Folded and Unfolded States.
- Site-Specific Thermodynamic Stability and Unfolding of a de Novo Designed Protein Structural Motif Mapped by C-13 Isotopically Edited IR Spectroscopy.
2013
- Electrochemical Generation of Hydroxyl Radicals for Examining Protein Structure.
- The stability of 2-state, 3-state and more-state proteins from simple spectroscopic techniques... plus the structure of the equilibrium intermediates at the same time.
- Antimicrobial Susceptibility and Resistance Patterns among Helicobacter pylori Strains from The Gambia, West Africa.
- Introductory Lecture: Interpreting and predicting Hofmeister salt ion and solute effects on biopolymer and model processes using the solute partitioning model.
- Zinc induced folding is essential for TIM15 activity as an mtHsp70 chaperone.
2012
- Protein Dynamics Governed by Interfaces of High Polarity and Low Packing Density.
- Unusual Cold Denaturation of a Small Protein Domain.
- Hydration Dynamics of a Halophilic Protein in Folded and Unfolded States.
- Amyloid Fibrils Formed by the Programmed Cell Death Regulator Bcl-xL.
- Worm-Like Ising Model for Protein Mechanical Unfolding under the Effect of Osmolytes.
- Contribution of Disulfide Bonds to Stability, Folding, and Amyloid Fibril Formation: The PI3-SH3 Domain Case.
2011
- Expanding the proteome: disordered and alternatively folded proteins.
- Charge-Surface Correlation in Electrospray Ionization of Folded and Unfolded Proteins.
- Observing the osmophobic effect in action at the single molecule level.
- Structural Analysis of an Equilibrium Folding Intermediate in the Apoflavodoxin Native Ensemble by Small-Angle X-ray Scattering.
- Underexposed polar residues and protein stabilization.
2011
- Stabilization of mutant p53 via alkylation of cysteines and effects on DNA binding.
- Why Hofmeister effects of many salts favor protein folding but not DNA helix formation.
- Interactions of the Osmolyte Glycine Betaine with Molecular Surfaces in Water: Thermodynamics, Structural Interpretation, and Prediction of m-Values.